Market Volatility and the Convergence of Macroeconomic Pressures
Global financial markets entered a period of heightened instability during the first full week of November 2026, as a confluence of political shifts, geopolitical escalations, and a reassessment of the artificial intelligence (AI) investment thesis triggered significant capital outflows. The Nasdaq Composite experienced a sharp 5.56% decline on November 5, 2026, marking its steepest daily drop in 19 months as investors weighed the implications of Democratic gains in the U.S. midterm elections [30][35]. This equity rout coincided with renewed U.S. military strikes against Iranian air defenses on Qeshm Island, intensifying concerns regarding stability in the Strait of Hormuz and energy price volatility [35][70].
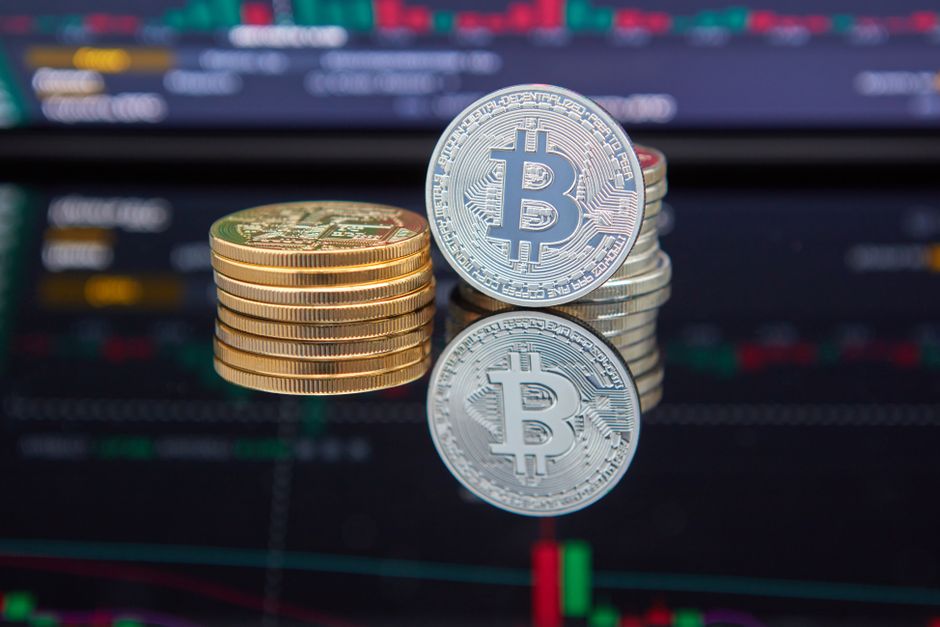
The volatility was not confined to traditional equities. The cryptocurrency market faced a parallel correction, with Bitcoin (BTC) slipping below the $76,000 threshold and Ethereum (ETH) testing support near $2,200 [70][43]. Institutional demand through exchange-traded funds (ETFs) showed signs of exhaustion, with U.S. spot Bitcoin ETFs recording approximately $1.28 billion in net withdrawals over the first five trading sessions of November [37][96]. As the Cboe Volatility Index (VIX) surged nearly 70% to reach 28.18 on Thursday, market participants began evaluating whether the current correction represents a temporary mean-reversion or the beginning of a more structural liquidation event [35][90].
The $3 Trillion Equity Vaporization and the AI Sentiment Shift
The U.S. stock market suffered a loss of approximately $3 trillion in market value during the November 5 session [30]. This reversal followed a brief rally on November 4, where the S&P 500 had gained 1.58% and the Dow Jones Industrial Average advanced roughly 3% in response to initial election results [30]. However, the subsequent Democratic sweep of both chambers of Congress introduced uncertainty regarding future corporate spending and technology regulations [30][63]. Analysts observe that Democratic control may lead to tighter oversight of the data center industry and rising electricity costs, potentially slowing the infrastructure development essential for AI growth [35][80].
Technology shares led the downturn, with Nvidia (NVDA) falling 9.26% in its worst session since the DeepSeek sell-off, resulting in a market value loss of approximately $450 billion [36]. Other semiconductor peers faced similar pressure; Advanced Micro Devices (AMD) and Micron Technology each recorded declines of approximately 17% [30]. The Philadelphia Semiconductor Index fell by roughly 12%, reflecting broader concerns that AI infrastructure spending may be peaking or facing regulatory bottlenecks [30][36]. In Texas, Democratic victories in midterm races raised specific concerns regarding regulatory obstacles for large-scale projects, including SpaceX’s proposed AI data centers and the Terafab semiconductor initiative [86].
Nvidia’s Technical and Fundamental Headwinds
Despite the sharp correction, Nvidia’s financial performance remains robust, with fiscal second-quarter 2027 revenue reaching $96.22 billion, a 105.8% year-over-year increase [36]. However, the stock’s technical outlook has turned bearish, as shares now trade below their 50-day simple moving average (SMA) of $219.77 and 200-day SMA of $204.39 [36]. The 14-day Relative Strength Index (RSI) for NVDA stood at 30.77 as of November 8, approaching the oversold threshold [36].
Geopolitical risks involving China continue to weigh on investor sentiment. Approximately 600,000 Nvidia H200 chips are reportedly being held in Hong Kong pending approval for shipment to mainland China, as Beijing encourages domestic firms to prioritize local alternatives [36]. Conversely, Chinese firms have placed orders for more than three million export-compliant RTX Pro 5500 graphics cards, representing a combined value exceeding $35 billion [36]. Analysts at Morgan Stanley have maintained an ‘Overweight’ rating on Nvidia with a $288 price target, suggesting that some institutional observers view the correction as a potential entry point, though price targets remain speculative [36].
The Federal Reserve and the Labor Market Paradox
The macroeconomic backdrop was further complicated by the U.S. employment report released on November 6, 2026. The economy added 165,000 nonfarm payroll jobs in October, significantly exceeding the consensus expectation of 65,000 [35][73]. The unemployment rate remained steady at 4.1%, while average hourly earnings rose 0.4% monthly and 3.1% annually [69][79]. These figures, combined with upward revisions of 84,000 jobs for August and September, suggest a labor market that remains resilient despite restrictive monetary policy [69][73].
Following the jobs data, futures markets priced in a roughly 78% to 80% probability of a Federal Reserve interest rate hike in December 2026 [35][73]. The 10-year Treasury yield responded by rising to approximately 4.88% on Friday, up from a low of 4.92% earlier in the week [73][63]. Higher yields typically increase the opportunity cost of holding non-yielding assets like Bitcoin and can pressure the valuations of high-growth technology companies that rely on debt financing for expansion [35][73].
Productivity Gains vs. Unit Labor Costs
Preliminary data from the Bureau of Labor Statistics showed that nonfarm business productivity rose 3.6% in the third quarter of 2026, while total output increased 3.7% [67]. This surge in productivity allowed unit labor costs to fall by 0.7% at an annualized rate during the quarter, as output per hour grew faster than hourly compensation [67]. Despite this quarterly dip, unit labor costs remained 2.4% higher than the previous year, leaving the long-term inflation outlook unresolved [67]. The Federal Open Market Committee (FOMC) maintained its target range at 3.75% to 4.00% on October 28, with a 10-2 vote where two officials favored an immediate increase [67].
Geopolitical Escalation and Energy Market Reactions
Geopolitical tensions intensified as President Donald Trump confirmed limited U.S. strikes against Iranian air defenses on Friday, November 6 [35]. These operations followed reports of fresh strikes on tankers in the Middle East, keeping energy markets in a state of high alert [70]. WTI crude oil returned above $90 a barrel, while Brent crude rose 2.5% toward $97 [70]. The potential for disruption in the Strait of Hormuz remains a primary concern for global trade and risk appetite, as energy price spikes can act as a "tax" on consumer spending and corporate margins [35].
Bitcoin’s Technical Fragility and the ETF Exodus
Bitcoin’s price action has mirrored the volatility in the technology sector, dropping more than 6% to $75,463 on Bitstamp, its lowest level since mid-September [70]. The decline triggered approximately $1 billion in total liquidations across the cryptocurrency market, underscoring the high degree of leverage currently present in the system [8][10]. On-chain data from CryptoQuant indicates that Bitcoin holders realized more than $2 billion in losses over a three-day period as the price fell below $80,000 [73].
The institutional channel through U.S. spot Bitcoin ETFs has shifted from a source of support to a source of selling pressure. On Friday, November 6, these funds recorded a net outflow of $411.9 million [96]. The selling was highly concentrated, with BlackRock’s IBIT accounting for $403 million in redemptions [96]. Conversely, Fidelity’s FBTC attracted $42.8 million in new capital during the same session, suggesting a lack of uniformity in institutional sentiment [96]. Cumulative net inflows for the month have shrunk from $58 billion to approximately $56 billion in just two weeks [11].
Technical Support Levels and the "Short Squeeze" Hypothesis
Bitcoin currently trades below its 50-day moving average near $79,000 and is resting on its 200-day average near $76,000 [11][55]. Analysts identify the daily pivot at $74,853.81 as a critical boundary; a sustained close above this level would be required to validate a recovery attempt [8]. Michaël van de Poppe suggests that reclaiming $75,000 is essential for buyers to regain control, with a failure to do so potentially exposing the $71,000 to $70,000 range [10][73].
Some market observers point to extreme derivatives positioning as a potential catalyst for a reversal. Crypto Rover noted that Bitcoin net shorts reached a significant high while longs stood at a relative low, a configuration that has historically preceded short squeezes [37]. Glassnode identified a major short-liquidation cluster near $87,000, suggesting that a move above $76,000 could force bearish traders to cover their positions, accelerating an upward move [37]. However, the daily RSI remains weak at 35.6, and the negative MACD histogram is widening, indicating that downside momentum has not yet reached exhaustion [8].
Ethereum’s Structural Challenges and Testnet Delays
Ethereum (ETH) has faced its own set of challenges, trading near $2,235 and remaining beneath its 50-day and 100-day exponential moving averages [43][48]. The asset has underperformed Bitcoin, with the ETH/BTC ratio hovering near 0.0295 [32]. Institutional interest in Ethereum ETFs has been particularly weak, with these funds recording five straight weeks of outflows [71]. On Friday, November 6, spot Ether ETFs shed $93.3 million, following a $99.9 million withdrawal on Thursday [43][95]. Total value locked (TVL) in the Ethereum network has also declined, falling to $43.2 billion from a monthly high of nearly $50 billion [43][48].
The Glamsterdam Upgrade and Gas-Accounting Risks
On the development front, the Ethereum Foundation announced a delay in the Hoodi fork of the Glamsterdam testnet [43][85]. The pause was implemented after researchers identified that certain applications might fail due to changes in gas-accounting assumptions [85]. Specifically, EIP-8037 and EIP-8038 propose to alter the costs of creating and accessing network state to better reflect resource usage [43][85]. These changes could invalidate "invariants"—conditions developers expect to remain true during contract execution—potentially affecting contracts with hardcoded gas limits or remaining-gas checks [43][85]. The Foundation is currently working with auditors from ChainSecurity and Dedaub to review eight identified invariants before a revised activation date is set [43][85].
Whale Accumulation vs. Derivatives Hedging
Despite the price weakness and technical delays, on-chain data shows significant accumulation by large holders. One whale address withdrew 18,550 ETH (worth over $42 million) from exchanges over five days, while another purchased 13,080 ETH (worth approximately $30 million) [13][49]. Institutional participant Bitmine added 5,000 ETH during the recent dip and now holds 4.96% of the total supply [49][51]. However, the whale-versus-retail delta remains negative, as market makers like Wintermute have opened substantial short positions, including $26.4 million in ETH shorts on Hyperliquid [13][51].
The AI Infrastructure Pivot: Miners Becoming Landlords
A significant structural shift is occurring among publicly listed Bitcoin mining companies, as they increasingly redeploy capital and infrastructure toward high-performance computing (HPC) and AI workloads. TeraWulf reported that HPC leasing generated $63 million in third-quarter revenue, accounting for 83% of its $76.2 million total [82]. The company has a 20-year lease agreement with Anthropic for 401 megawatts of capacity, representing approximately $19 billion in contracted revenue over the initial term [82].
Similarly, IREN (formerly Iris Energy) reported that quarterly AI Cloud revenue nearly tripled to $200 million, while its Bitcoin mining revenue fell from $67 million to $28 million [81]. Hut 8 has also expanded its AI commitments, fully commercializing its Beacon Point campus with a second 352 MW lease [14]. To fund these transitions and share repurchases, Hut 8 sold approximately 3,102 Bitcoin during and after the third quarter [14]. Riot Platforms followed a similar strategy, selling 20,264 BTC in the first nine months of 2026 to raise $1.5 billion for data center development [15]. These moves suggest that for many large-scale operators, the value of power connections and grid access now rivals the value of the Bitcoin network itself [15][82].
Solana’s Fundamental Growth vs. Price Stagnation
Solana (SOL) continues to trade under pressure, falling below the $90 level despite recording significant technical milestones in October 2026 [45]. The network successfully deployed the Alpenglow consensus engine, which targets transaction finality of approximately 150 milliseconds [45][83]. Additionally, target slot times were reduced from 400 milliseconds to 200 milliseconds, doubling the speed of block production [45][83]. The implementation of Alpenglow also changed validator voting mechanics; votes are no longer posted as on-chain transactions, freeing up significant block space as votes previously accounted for 63% of all Solana transactions [45][46].
Research from Fidelity Digital Assets found that Solana accounted for roughly 15% of the trades measured against major U.S. exchanges in 2026, briefly surpassing the New York Stock Exchange (NYSE) in weekly execution counts [41]. Fidelity noted that monthly tokenized-asset trading volume on Solana grew from under $100 million to nearly $5 billion over the past year [41]. Despite these fundamentals, SOL has faced a 28% slide from its October high, and spot Solana ETFs recorded no net inflows for 12 consecutive trading sessions as of November 8 [45][59].
The Tokenization Frontier and Institutional Integration
The integration of traditional finance and blockchain infrastructure continues to advance through tokenization initiatives. Amundi, one of Europe’s largest asset managers, launched a tokenized share class of its Core STOXX Europe 600 equity index fund on the public Ethereum blockchain [74]. This initiative uses infrastructure developed with CACEIS to record and distribute interests in the fund, aiming for improved operational efficiency and quicker settlement [74].
In the Middle East, Ripple contributed to a white paper commissioned by the Dubai Financial Services Authority (DFSA) titled “Scaling Tokenization: The Road Ahead” [50]. The report, which included input from BlackRock and Standard Chartered, highlighted the potential for tokenized traditional assets to reach a market size of $5.5 trillion by 2030 (Citi Institute projection) or up to $30.1 trillion by 2034 (Standard Chartered/Synpulse estimate) [50]. Ripple Managing Director Reece Merrick emphasized the utility of tokenized treasuries as on-chain collateral for repo and margin markets, which move trillions of dollars daily [50].
Technical Deep Dive: Support and Resistance Across Major Assets
As of November 9, 2026, the technical landscape for major digital assets remains predominantly defensive, with short-term rebounds struggling against established daily downtrends.
Bitcoin (BTC)
- Current Price: ~$74,445.35 [8]
- Immediate Resistance: Daily pivot at $74,853.81; Hourly EMA20 at $75,044.04 [8]
- Key Support: Daily Bollinger lower boundary at $74,015.94; Daily S1 at $73,507.63 [8]
- Momentum: Hourly RSI is oversold at 28.2, but daily RSI is falling at 35.6 [8].
Ethereum (ETH)
- Current Price: ~$2,124.58 [4]
- Immediate Resistance: Daily lower Bollinger Band at $2,143.35; Daily pivot at $2,144.49 [4]
- Key Support: Hourly S1 at $2,079.71; Daily S1 at $2,042.97 [4]
- Momentum: Hourly RSI is extremely oversold at 17.0, while daily RSI stands at 32.9 [4].
Solana (SOL)
- Current Price: ~$86.84 [9]
- Immediate Resistance: Daily pivot at $87.19; Daily R1 at $89.36 [9]
- Key Support: Daily Bollinger lower band at $85.50; Daily S1 at $84.37 [9]
- Momentum: Daily RSI is firmly oversold at 26.8 [9].
XRP
- Current Price: ~$1.16 [29]
- Immediate Resistance: $1.19–$1.21; Weekly pivot at $1.27 [94]
- Key Support: $1.15; $1.07–$1.11 area [54][61]
- Momentum: Daily RSI has fallen toward 32, indicating stretched selling pressure [94].
Commitment of Traders (COT) and Currency Market Sentiment
The latest Commitment of Traders (COT) data through November 3, 2026, reveals extreme positioning among large speculators, which often serves as a contrarian indicator for market reversals. The Australian Dollar (AUD) reached a new all-time record bearish level with -129,457 net contracts, resulting in a 0% strength score over a 3-year range [20]. Similarly, the Euro (EUR) and Natural Gas also recorded 0% strength scores, indicating extreme bearish sentiment among for-profit speculators [21].
Conversely, the 1-Month Secured Overnight Financing Rate (SOFR) speculator position is the most bullish extreme, with a 95% strength score [21]. The U.S. Dollar Index (DXY) remains in a consecutive bullish phase for 24 straight weeks, closing at 102.18, slightly above its 200-week moving average [20]. In the metals market, Silver led weekly speculator gains with a modest rise of 1,548 contracts, though it remains in extreme-bearish territory with a 16% strength score [25].
Corporate Strategy and the "Bitcoin Bank" Vision
Strategy (formerly MicroStrategy) continues to evolve its corporate identity, with CEO Phong Le stating that the company aims to become the “Bitcoin bank of the world” [38]. The firm currently holds 845,000 BTC and utilizes its STRC preferred stock, which carries a 12% dividend rate, as part of its financial infrastructure [38]. Executive Chairman Michael Saylor has urged traditional banks to hold and lend against Bitcoin, positioning Strategy at the convergence of traditional and decentralized finance [38].
However, the company’s latest Bitcoin purchase of 811 BTC was executed at an average price of $80,846, which is currently above the spot market price [31]. Strategy’s aggregate purchase price for its entire position stands at $64.08 billion, with a blended acquisition cost of $75,451 per coin [31]. As Bitcoin trades near this aggregate basis, the company’s treasury strategy faces increased scrutiny regarding its sensitivity to further price declines [31][17].
The Retirement Market: 401(k)s and Crypto Access
The Trump administration has taken steps toward opening the $10.8 trillion U.S. retirement market to digital assets. The Department of Labor (DOL) submitted a proposed regulatory framework to the White House on November 5, 2026, outlining how fiduciaries can assess alternative investments like Bitcoin for employer-sponsored 401(k) plans [33]. The framework identifies six areas for consideration: performance, fees, liquidity, valuation, benchmarks, and investment complexity [33]. Analysts suggest that even a 2% allocation of 401(k) assets to cryptocurrency could translate into approximately $216 billion in potential inflows, though such an allocation remains theoretical and has faced criticism from lawmakers concerned about volatility risks [33].
Conclusion: A Market at a Crossroads
The current market environment is characterized by a sharp divergence between improving network fundamentals and deteriorating price action. While Solana and Zcash have successfully implemented major protocol upgrades, and institutional tokenization projects from Amundi and Ripple are gaining traction, the broader market remains tethered to macroeconomic and political uncertainty. The $3 trillion loss in U.S. equity value and the $1.28 billion exodus from Bitcoin ETFs suggest a significant reduction in risk appetite as the "higher-for-longer" interest rate narrative gains renewed momentum following strong jobs data.
Investors are now focused on the October Consumer Price Index (CPI) report scheduled for Tuesday, November 10, which is expected to show a cooling in the monthly rate to +0.2–0.3% [32][76]. A softer-than-expected inflation print could ease rate-hike fears and provide a catalyst for a relief rally. Conversely, persistent inflation or further geopolitical escalation in the Middle East may exacerbate the current liquidation event, testing the resolve of long-term holders and the structural support levels identified across both traditional and digital asset classes.
What We Don’t Know
The provided reports do not confirm whether the recent U.S. strikes in Iran will lead to a broader regional conflict or a sustained disruption of oil supplies through the Strait of Hormuz. It remains unclear if the Ethereum Foundation’s Glamsterdam testnet delay will impact the eventual mainnet upgrade schedule or if the identified gas-accounting risks will require significant code rewrites for major DeFi protocols. Furthermore, while whale accumulation is evident in on-chain data, the sources do not establish whether this buying is sufficient to offset the aggressive short positioning held by major market makers like Wintermute.