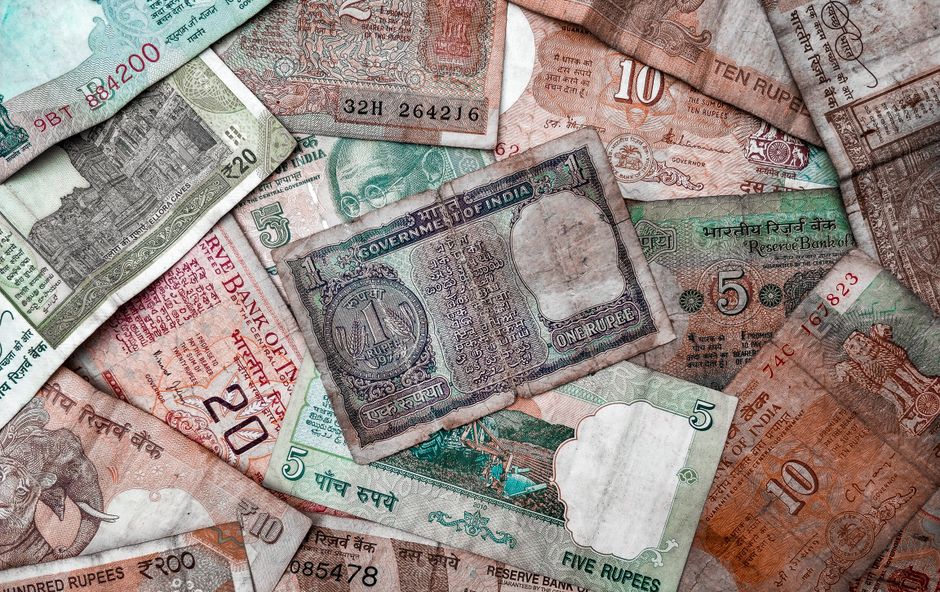
The intersection of the British Pound (GBP), the Indian Rupee (INR), and the Nifty 50 index currently serves as a critical barometer for emerging market stability amidst a volatile global macroeconomic backdrop. As of late October 2026, the Indian financial landscape is navigating a complex "double whammy" characterized by persistent rupee depreciation and a softening equity market [35]. Analysts observe that this synchronized pressure is primarily fueled by elevated crude oil prices, surging global bond yields, and a pronounced shift toward risk aversion among international investors [35]. While the Dow Jones Industrial Average has shown defiant resilience, hitting monthly highs above 52,490, the Indian Nifty 50 has languished, matching its longest losing streak in a quarter-century with eight consecutive weekly declines [34] [35].
The Rupee Under Pressure: GBP/INR and USD/INR Dynamics
The GBP/INR currency pair has recently traded near the 126.4 level, positioned within a monthly fluctuation range of approximately 125.46 to 128.54 [35]. Market data suggests that the current strength of the pair is less a reflection of sterling's independent momentum and more a consequence of underlying rupee weakness [35]. Sterling itself has been holding around the 1.33 mark against the U.S. dollar, while the rupee has faced significant structural depreciation [35].
The USD/INR pair provides further context for this currency stress, moving between 95 and 97 throughout October 2026 [35]. The rupee slumped to 96.32 per dollar on October 1, though it saw a brief recovery toward 95 by October 13 following intensified foreign exchange regulations by the Reserve Bank of India (RBI) [35]. The RBI has remained active in defending the currency against capital flow pressures and the inflationary impact of oil [35]. This defensive stance is critical as India, a net energy importer, faces an inflated import bill with Brent crude prices hovering near $108 to $110 per barrel [13] [35].
For UK-based entities or individuals sending remittances to India, the 126.4 level represents a significant threshold [35]. Technical analysis identifies immediate support for GBP/INR at 125.46, while resistance is pegged at 128.54 [35]. A breach above this resistance would signal further rupee deterioration, whereas a drop below support would indicate a potential recovery for the Indian currency [35].
Nifty 50: Analyzing the "Slower Bleed" in Indian Equities
The Nifty 50 index closed at 22,888.95 on October 19, marking a 1.11% daily decline [35]. This downward movement is part of a broader trend that has seen the index lose more than 7% of its value over a two-month period [35]. Analysts characterize this as a "slower bleed" compared to more violent crashes seen in other regional markets, such as South Korea's Kospi, which fell over 40% from its June peak [36].
Several technical hurdles now face the Nifty 50. The index is languishing near its October 2023 lows of 22,182.55 [35]. Resistance levels are currently established at the 23,000 round number, followed by 23,150 and a psychological barrier at 23,400 [35]. On the downside, support is identified at 22,800, with the 22,183 level serving as a critical floor [35]. A close below 22,183 could target the 22,000 psychological level [35].
The sentiment in Indian equities is further dampened by aggressive foreign institutional investor (FII) selling [35]. In 2026, foreign buyers reportedly withdrew a record $27.8 billion from Indian equities, favoring the safety of the U.S. dollar [35]. Furthermore, in the most recent derivative series, foreign investors increased their short positions in index futures, suggesting a defensive posture that may continue to cap potential rallies [35]. The India VIX, often referred to as the "fear gauge," rose 4.98% to 14.76, indicating heightened investor nerves [35].
The Global Yield Catalyst: U.S. Treasuries and Emerging Markets
The pressure on Indian assets cannot be isolated from the shifts in the U.S. bond market. The 10-year Treasury yield recently reached its highest point since 2002, nearing the 5% mark [14]. This surge makes dollar-denominated assets significantly more appealing than equities in developing nations, contributing to the capital flight observed in the Nifty 50 [35].
The 20-year Treasury bond has also seen historic shifts. At a recent auction, the 20-year bond sold at a yield of 5.469%, the highest since its reintroduction in 2020 and the highest auction yield since 1986 (with the caveat that issuance was discontinued for decades) [2]. This yield was necessary to attract demand for the $13 billion offering, as institutional interest remains thin [2]. The auction produced a "tail" of 0.9 basis points, suggesting that demand was weaker than the market had anticipated [2]. High yields on long-term U.S. debt increase the opportunity cost for holding stocks, particularly those with high valuations in emerging markets [14].
Furthermore, the U.S. Federal Reserve's policy trajectory remains a primary concern. Markets recently placed the odds of a December interest rate hike at approximately 91% [14]. Persistent inflation, with the September Consumer Price Index (CPI) rising 3.7%, has revived fears that the Fed will maintain a restrictive stance for longer than previously expected [14] [36].
Comparative Equity Performance: Global Resilience vs. Regional Weakness
While Indian and South Korean markets have struggled, the Dow Jones Industrial Average has demonstrated remarkable strength. The Dow climbed over 1% on October 20 to hit monthly highs above 52,490, putting it on track for a third straight weekly gain [34]. This resilience is attributed to a rotation into established value stocks with solid cash flows and defensive qualities, particularly in the healthcare and industrial sectors [34]. Healthcare companies like UnitedHealth, Merck, and Johnson & Johnson led the index higher, even as technology stocks faced headwinds [34].
In contrast, other global indices have mirrored the Nifty's softness. The FTSE 100 fell 1.08% to close at 10,764.69 on October 19, halting a three-session winning streak [16]. The reversal was driven by a 3.5% drop in Barclays shares following reports of a Bank of England investigation into private-credit loans, which dragged the broader banking sector down by 2.3% [16]. Additionally, a slide in copper prices led to significant losses for miners like Anglo American (down 4.1%) and Glencore (down 3.3%) [16].
The Hang Seng Index (HSI) has also remained capped below 24,670, struggling with a tech-led wobble and weak trend strength [8]. The HSI is currently stuck between 24,100 and 24,300, with immediate resistance at 24,234 [8]. Analysts note that the 50-day moving average crossed below the 200-day average in mid-September, confirming a downtrend [8].
The Technology and AI Valuation Reset
A significant factor in recent market volatility is the reassessment of AI and semiconductor valuations. The Nasdaq 100 recently experienced its largest weekly drop since April 2025, falling approximately 5.5% [14]. The Philadelphia Semiconductor Index also took a substantial hit, dropping over 10% and wiping out an estimated $2 trillion in market value [14].
Nvidia (NVDA) has been a focal point of this volatility. As of October 20, Nvidia's price settled at $216.47, following a five-day pullback of roughly 5% [30]. The stock is currently testing support between $209 and $214 [30]. A close below $209 could open the door to $200 or even the $190 psychological level [30]. Conversely, resistance is noted between $224 and $227 [30]. Momentum for Nvidia remains weak, with the 14-day RSI stuck in the high 30s [30].
Other technology giants are also facing scrutiny. Netflix (NFLX) shares tumbled to $64 in pre-market trading following an underwhelming earnings report [27]. While Q3 revenue grew 11.8% to $12.87 billion, investors were concerned by a trimmed 2026 ad revenue forecast of $2.7 billion and a Q4 revenue projection that fell short of consensus estimates [29]. Technical analysis suggests Netflix is approaching a "death cross" pattern on the weekly chart, with the 50-week moving average narrowing toward the 200-week average [27].
IREN stock has also slumped to its lowest level since September of the previous year, trading at $26.62 [18]. The company faces headwinds as it pivots from Bitcoin mining to AI, with its debt soaring to over $7.8 billion [18]. Billionaire Ken Griffin has warned of an "AI bubble," comparing the current phase to the dot-com era [18]. The AI Bubble Index has reportedly jumped to an extreme level of 74 [18].
Commodity Pressures: The Oil Factor
Crude oil remains a central driver of inflation and currency pressure, particularly for India. Brent crude oil prices have settled around $110 per barrel after bouncing back from mid-summer lows near $70.86 [13]. Technical indicators suggest a constructive breakout pattern, with a rounding bottom and cup formation visible on the daily chart [13]. The 50-period moving average has crossed above the 200-period average, creating a "golden cross" that attracts speculative interest [13].
The most critical resistance for Brent is near $112.80 per barrel [13]. A daily close above this level could open the path toward $120.00 or $125.00 [13]. On the downside, the $100.00 psychological level serves as primary support [13]. High energy prices directly threaten consumer spending and profitability across multiple sectors, increasing the likelihood of further interest rate hikes by central banks [14].
The U.S. Real Estate Freeze as a Macro Indicator
The U.S. housing market is currently experiencing a historic affordability crisis that serves as a forward-looking indicator of broader economic health. Mortgage applications to purchase a home plunged for the seventh consecutive week in mid-October, reaching levels not seen since the early 1990s [5]. Compared to the same week in 2019, purchase applications have collapsed by 47% [5].
Pending home sales in September also plunged to record lows, dropping 7.3% from August and 11.3% year-over-year [43]. This collapse is attributed to the combination of high home prices and mortgage rates that have remained in the 6% to 8% range since September 2022 [43]. The average 30-year fixed mortgage rate was recently reported at 7.41% [5].
Refinance applications have also dried up, falling 57% year-over-year [5]. Analysts note that the housing market has been effectively "frozen" for four years, as the home price explosion from 2020 to 2022—fueled by low rates and quantitative easing—has made prices economically unsustainable [5]. In some markets, prices have begun to correct, with Austin, TX seeing a 26% decline and Oakland, CA dropping 23% [43].
Digital Assets: Bitcoin and Ethereum Technical Outlook
In the cryptocurrency sector, Bitcoin (BTC) has recently pushed back above the $83,000 level, attempting to reinstall itself within a rising channel after a month of sideways action [31]. As of October 21, Bitcoin trades at $83,554.00 on Binance [26]. The daily structure remains bullish, with price sitting above the 20-day ($82,614), 50-day, and 200-day exponential moving averages (EMAs) [26].
However, momentum signals are mixed. The daily MACD histogram remains negative, leaving the recovery unconfirmed [26]. An hourly close above the R1 resistance at $83,600.18 is identified as the immediate breakout trigger [26]. Conversely, a close below the hourly pivot at $83,493.83 would signal that the advance is losing footing [26]. The Fear & Greed Index currently stands at 63, classified as "Greed" [26].
Ethereum (ETH) has climbed 2.5% over 24 hours to just under $2,450, but remains below the critical $2,500 psychological threshold [28]. U.S. spot Ethereum ETFs recorded nearly $389 million in cumulative net outflows over five trading sessions, highlighting a lack of institutional momentum [28]. Despite this, corporate demand persists; Bitmine Immersion Technologies recently added 12,535 ETH to its holdings, which now total 6.04 million ETH—approximately 4.9% of the circulating supply [28].
Other digital assets show varying degrees of strength. XRP is hovering around $1.30, with immediate support at $1.27 [41]. Ripple recently filed a 20-page comment letter supporting the SEC's proposed Regulation Crypto Assets, seeking greater regulatory clarity [11]. Meanwhile, Pearl (PEARL) saw its price accelerate above $2.20 following its addition to the Coinbase asset-listing roadmap [32]. Kaspa (KAS) gained 10.69% following a development milestone for its KCC-20 token standard, though daily active users fell sharply from 36,570 to 7,910 [17].
Speculative AI Projections for 2027
Several AI models have provided highly speculative, "peak bull-market" scenarios for digital assets by January 1, 2027. These forecasts assume extraordinary catalysts that are currently considered unlikely by market analysts:
- Bitcoin: Claude AI suggests a target of $250,000, predicated on a major G20 economy announcing a strategic Bitcoin reserve [39].
- Ethereum: Claude AI predicts a range of $35,000 to $80,000, assuming sovereign wealth funds and central banks adopt coordinated ETH staking [3].
- XRP: Grok AI outlines a scenario where XRP reaches $25 to $75, based on the IMF and G20 nations selecting the XRP Ledger for a new digital reserve framework [4].
- Cardano (ADA): ChatGPT predicts a surge to $8-$25, assuming the blockchain is selected as infrastructure for decentralized scientific research funding [6].
- Chainlink (LINK): Google Gemini AI suggests a target of $150 to $300, driven by widespread institutional adoption of its oracle infrastructure [38].
Analysts emphasize that these projections are for informational purposes and do not represent realistic base-case outlooks [3] [6] [38].
Corporate and Sectoral Developments
In the banking sector, Lloyds Banking Group has seen its share price extend recent losses, trading below its 52-week high of 123p [33]. While H1 profit before tax rose 23% to £4.3 billion, the bank faces headwinds from a potentially tougher credit environment and a possible increase in the UK bank profits surcharge [33]. Technical support for Lloyds is currently being tested at 101.95p [33].
Retail giant Walmart (WMT) has rebounded to $117 after hitting a low of $102 in September [15]. However, valuation concerns persist, as the company trades at a forward price-to-earnings multiple of 41, significantly higher than the sector average of 14 [15]. Technical analysis suggests bulls are targeting the $130 level [15].
In the mining and exploration sector, Equinox Gold reported solid third-quarter production and remains on track to hit its annual guidance of roughly 1.1 million ounces [1]. The company has aggressively repaid over $1 billion in debt since the start of the year [1]. Fortuna Mining continues to report strong drill results at Diamba Sud in West Africa, indicating potential for additional reserves beyond current open-pit plans [44].
The proprietary trading firm Hola Prime recently launched a consolidated "Rulebook" to simplify account requirements and removed three major restrictions on funded accounts, including the 60% maximum concentration per trade and the 70% maximum margin rule [10].
Conclusion: Synthesis of Market Signals
The current financial landscape is defined by a stark divergence between resilient U.S. blue-chip equities and the mounting pressures facing emerging markets like India. The GBP/INR pair at 126.4 and the Nifty 50's struggle near 22,800 reflect a broader environment where high oil prices and surging U.S. Treasury yields are siphoning capital away from riskier assets [35]. While the Dow Jones finds support in defensive value, the technology sector is undergoing a necessary valuation reset as the costs of financing AI infrastructure expansion rise [14] [34]. For the Indian market, a sustained recovery likely hinges on a stabilization of Brent crude prices and a moderation in global bond yields [35]. Until such catalysts emerge, the "managed depreciation" of currencies and the "slower bleed" of equities remain the dominant themes for the final quarter of 2026.
What We Don't Know
While current data highlights significant pressure on the rupee and Indian equities, it remains unclear whether the Reserve Bank of India will escalate its intervention strategies if Brent crude sustains a move above $112.80. Additionally, the provided sources do not confirm the specific outcome of the Bank of England's investigation into Barclays, which could have broader implications for UK and global banking sentiment. Finally, the impact of the upcoming U.S. midterm elections on market volatility remains a subject of historical correlation rather than certain prediction.